19F-NMR determines fluoropolymer precursor molecular weight by comparing integrated fluorine signals from unreacted monomer and newly formed polymer environments. For TFVE-type monomers, geminal and vicinal fluorine resonances provide identifiable reference signals, while polymerization produces cyclobutyl fluorine signals in a separate chemical-shift region. Integrating these signals gives the degree of polymerization (DP), which can then be converted into number-average molecular weight, (M_n), using the repeat-unit mass.
The key is signal assignment and quantitative integration: monomer-specific fluorine peaks establish the starting-material reference, polymer-specific peaks indicate conversion and chain formation, and unexpected fluorine peaks reveal fluorinated impurities.
How 19F-NMR Separates the Relevant Species
Monomer fluorine environments
In TFVE precursor analysis, geminal fluorine atoms produce distinct resonances near −126.3 ppm and approximately −133.8 ppm. Vicinal fluorine atoms appear near −119.5 ppm.
These signals act as spectral fingerprints for the precursor structure. Their positions and relative integrals help confirm that the expected monomer has been produced and that its fluorinated groups are chemically intact.
Signals formed during polymerization
Polymerization changes the local chemical environment of the fluorinated groups. New cyclobutyl fluorine resonances appear approximately between −131.5 and −127.8 ppm.
Because these polymer-derived signals occupy a distinguishable region from the principal monomer signals, the spectrum can separate unreacted precursor from fluorinated units incorporated into polymer chains.
Why fluorine provides a strong analytical signal
The (^{19}\mathrm{F}) nucleus has near-100% natural abundance and high sensitivity. This allows fluorinated monomers, repeat units, defects, and impurities to be observed without isotopic enrichment.
That sensitivity is particularly valuable when small amounts of residual precursor or trace fluorinated by-products could affect subsequent polymer processing.
How Molecular Weight Is Calculated
First, assign and integrate the peaks
The analyst records a quantitative (^{19}\mathrm{F})-NMR spectrum and assigns the signals to:
- Unreacted monomer fluorines
- Polymer-associated cyclobutyl fluorines
- Other identifiable fluorinated end groups or structural units
The area under each resonance is proportional to the number of fluorine nuclei contributing to that signal, provided the acquisition uses appropriate quantitative NMR conditions.
Then, calculate the degree of polymerization
The integrated polymer signal is compared with the integrated monomer or end-group reference signal. After correcting for the number of fluorine atoms represented by each environment, the result provides the degree of polymerization, DP.
Conceptually, the calculation follows:
[ DP \propto \frac{\text{integrated polymer-associated fluorine}}{\text{integrated reference fluorine}} ]
The exact expression depends on the precursor structure, the fluorine count per repeat unit, and whether a chain-end or residual-monomer signal is being used as the reference.
Finally, convert DP into number-average molecular weight
Once DP has been established, the number-average molecular weight is estimated from the repeat-unit mass:
[ M_n \approx DP \times M_{\text{repeat unit}} + M_{\text{end groups}} ]
For a precursor or low-molecular-weight oligomer, end-group contributions may be significant and should be included. For longer chains, the repeat-unit term generally dominates, but the calculation still depends on correct structural assignment.
What the result represents
This approach gives number-average molecular weight, (M_n), because it is based on the average number of repeat units per molecule or the relationship between repeat units and chain ends.
It does not by itself provide the full molecular-weight distribution. Techniques such as size-exclusion chromatography may be needed to determine dispersity and the separate weight-average molecular weight.
How Impurities Are Detected
Identify peaks outside the expected precursor pattern
A pure precursor should show the expected monomer resonances with consistent chemical shifts and integral ratios. Additional fluorine-containing peaks indicate other molecular species that contain fluorine.
The spectrum therefore functions as both a structural fingerprint and a fluorinated impurity screen.
Detect tetrafluoroethyl ether
One relevant impurity, tetrafluoroethyl ether, appears as faint resonances in the region of approximately −136.2 to −136.5 ppm.
These peaks may be small relative to the main monomer signals, but the high sensitivity of (^{19}\mathrm{F})-NMR makes them detectable when the spectrum is acquired and processed appropriately.
Estimate impurity levels by integration
The impurity signal can be integrated and compared with a known reference signal. After accounting for the number of fluorine atoms in the impurity and reference species, the relative amount can be estimated.
For reliable quantitation, the method must use suitable relaxation delays, consistent acquisition parameters, adequate signal-to-noise, and validated response assumptions. A visible impurity peak is evidence of contamination; accurate concentration measurement requires quantitative method control.
What Structural Information Supports the Measurement
Verify monomer composition and sequence structure
For fluoropolymers such as TFE-VDF copolymers and TFE-VDF-HFP terpolymers, (^{19}\mathrm{F})-NMR can distinguish different fluorinated groups, including (-\mathrm{CF_2}-), (-\mathrm{CFH}-), and (-\mathrm{CF_3}) environments.
With multidimensional (^{19}\mathrm{F})-NMR and correlated (^{1}\mathrm{H}), (^{19}\mathrm{F}), and (^{13}\mathrm{C}) experiments, analysts can evaluate monomer composition, sequence distributions, and monomer inversions.
Detect defects and local structural differences
Fluorine chemical shifts are sensitive to stereochemical and regiospecific changes. This makes the technique useful for identifying branch sites, inversion defects, stereoisomers, and variations in local molecular motion.
These observations help distinguish a molecular-weight result arising from the intended structure from one affected by unexpected defects or side reactions.
Use modeling when assignments are ambiguous
When several fluorinated environments overlap, quantum-chemical calculations such as DFT with GIAO shielding methods can support chemical-shift assignments.
Modeling does not replace experimental integration, but it can help determine which signals belong to particular structural motifs before DP or impurity calculations are performed.
Understanding the Trade-offs
Molecular weight depends on correct assignments
The DP calculation is only as reliable as the peak assignments and fluorine-count corrections behind it. Overlapping signals, unrecognized end groups, or incorrect assumptions about the repeat unit can produce a precise-looking but incorrect (M_n).
(^{19}\mathrm{F})-NMR does not replace every characterization method
(^{19}\mathrm{F})-NMR is highly effective for fluorinated species, but it does not directly provide complete molecular-weight distribution information. SEC, mass spectrometry, (^{1}\mathrm{H})-NMR, or (^{13}\mathrm{C})-NMR may be needed to resolve nonfluorinated groups, dispersity, or complementary structural details.
Trace detection requires controlled acquisition
Weak impurity signals can be obscured by noise, imperfect phasing, baseline distortion, or inadequate relaxation delays. A routine qualitative spectrum may reveal contamination, but release-quality quantitative measurements require validated experimental parameters.
Chemical shift is not a universal identity by itself
A peak near a reported chemical-shift range should be interpreted alongside the full spectrum, expected fluorine count, sample history, and, where necessary, multidimensional correlations or an authentic reference material.
Making the Right Choice for Your Goal
Use the measurement objective to determine how the spectrum should be acquired and interpreted.
- If your primary focus is estimating molecular weight: Assign the monomer and polymer-specific fluorine resonances, integrate them quantitatively, calculate DP with fluorine-count corrections, and convert DP using the repeat-unit and end-group masses.
- If your primary focus is detecting precursor impurities: Compare the spectrum with the expected monomer fingerprint and inspect for additional resonances, including faint tetrafluoroethyl ether signals near −136.2 to −136.5 ppm.
- If your primary focus is verifying polymer microstructure: Combine one-dimensional (^{19}\mathrm{F})-NMR with multidimensional correlations to evaluate composition, sequence distribution, inversion, and structural defects.
- If your primary focus is qualifying material for sensitive applications: Use validated quantitative acquisition and complementary analytical methods to confirm low impurity levels and structural uniformity before processing.
With correct assignments, quantitative integration, and appropriate complementary tests, (^{19}\mathrm{F})-NMR provides a direct way to verify fluoropolymer precursor identity, estimate (M_n), and detect contamination before it affects manufacturing or analysis.
Summary Table:
| Purpose | Key Spectral Features | Calculation/Detection Method |
|---|---|---|
| Molecular Weight Determination | Monomer fluorine signals (e.g., geminal at -126.3 ppm, -133.8 ppm; vicinal at -119.5 ppm) vs. polymer cyclobutyl signals (-131.5 to -127.8 ppm) | Integrate polymer vs. monomer signals, compute DP, then Mn = DP × repeat unit mass + end groups |
| Impurity Detection | Unexpected peaks outside monomer pattern; tetrafluoroethyl ether at -136.2 to -136.5 ppm | Integrate impurity peak relative to reference, correct for fluorine count, calculate concentration |
| Structural Verification | Chemical shifts for -CF2-, -CFH-, -CF3; multidimensional correlations for sequence and defects | Compare with expected shifts; use DFT model if ambiguous |
Ensure your fluoropolymer precursors meet the highest purity and molecular weight standards. At KINTEK, we specialize in advanced PTFE and PFA labware and custom solutions for precise fluoropolymer analysis. From high-purity digestion vessels to custom NMR sample holders, our products support accurate 19F-NMR workflows. Contact us today to optimize your analytical setup and enhance your material quality.
Related Products
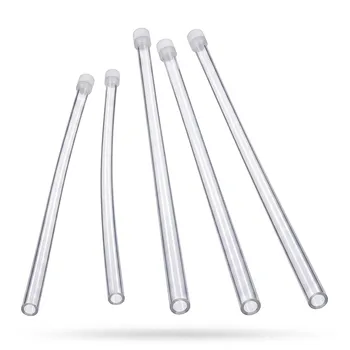
- Corrosion Resistant PFA NMR Tubes with PTFE Caps for High Temperature Trace Analysis Applications
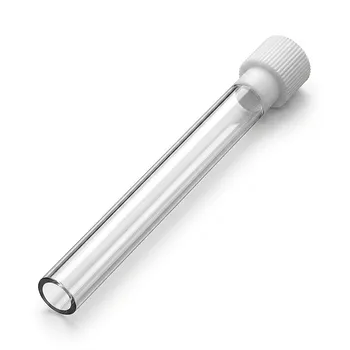
- High Purity PFA NMR Sample Tubes with Precision PTFE Caps for Strong Corrosion Resistance and High Temperature Laboratory Applications
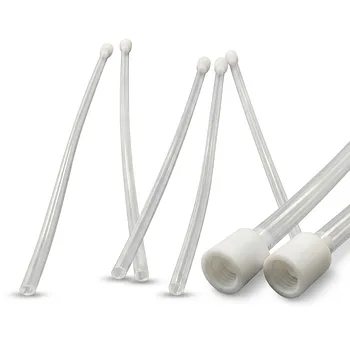
- High Purity PFA NMR Sample Tubes with PTFE Caps Corrosion Resistant Fluoropolymer Labware
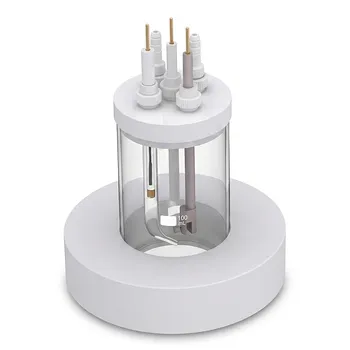
- All Quartz Mini Photoelectrochemical Cell Open System for Spectroscopy and Electrochemistry
- Quartz Thin Layer Spectroelectrochemical Cell Integrated Spectrophotometric Analysis Hermetic Electrochemical Cell